EarthChem Systems Tutorial
EarthChem’s Portal offers access to geochemical data in federated geochemical databases, including PetDB, GEOROC, NAVDAT, SedDB, the Deep Lithosphere Dataset, the USGS National Geochemical Database, MetPetDB, and the GANSEKI database.
This tutorial explains how to extract an integrated table of your desired geochemical data.
The two main steps to getting your integrated dataset are:
- Constrain sample selection
- Choose the data display and geochemical parameters
Constrain Sample Selection
Sample selection is set on the Portal Search page.
The sample selection can be constrained by:
Reference | Keyword | Sample ID | Location | Geologic Province | Ocean Feature Name | Volcano Name | Sample Type | Chemistry
Reference
Obtain samples that were reported in a particular reference (article, report).
- Author: should be an exact match of the last name (e.g. Shaw)
- Title: full title or title fragment
- Journal: full journal name or name fragment
- DOI: e.g.: 10.1016/0012-821X(95)00023-6
Keyword
The keyword query searches a generic descriptor field contained in the EarthChem schema. This is a free-text field that allows the supported datasets to provide a descriptor of their own choosing. Most often, this field contains a short sample description providing the sample’s location and composition. The keyword search also includes rock name in the queried results.
Sample ID
Sample IDs are the names used by the federated databases. The different databases have their own conventions, but if you have the sample ID from a particular database, you may search for it here. The sample name must be the complete name (not a fragment). The search will return samples with similar names, (common typos such as 1 for lowercase L), and dashes do not matter, for example, ML12 will return ML-12 and M112.
Some databases use a repeatable convention for unique sample naming, PetDB typically gives some combination of Ship, Expedition/Cruise (name or leg), station, and sample, for example:
ODP0176-0735B-001R-001/035-037
Ocean Drilling Program, leg 176, hole 735B, core 1R, section 1, 35-37 centimeters
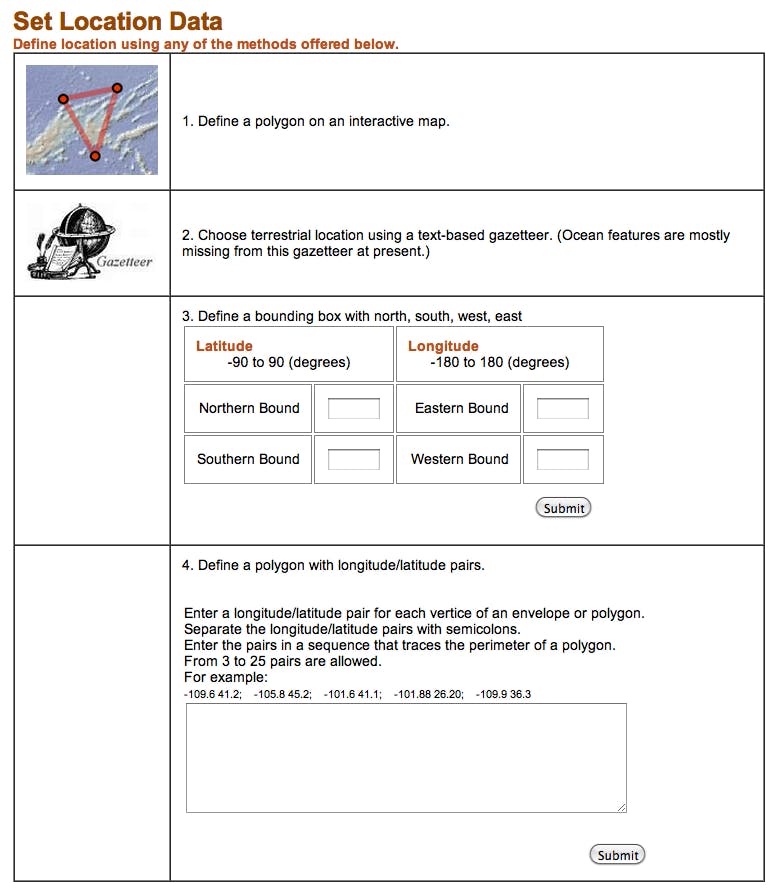
Location
You can set the location in four different ways.
- Define a polygon by clicking on an interactive map
- Choose a terrestrial location using a text-based gazetteer.
- Define a bounding box with N, S, E, W boundaries
- Define a polygon with longitude/latitude pairs
After you set your constraint and click the Submit button, the query page will show a map of your area of interest.
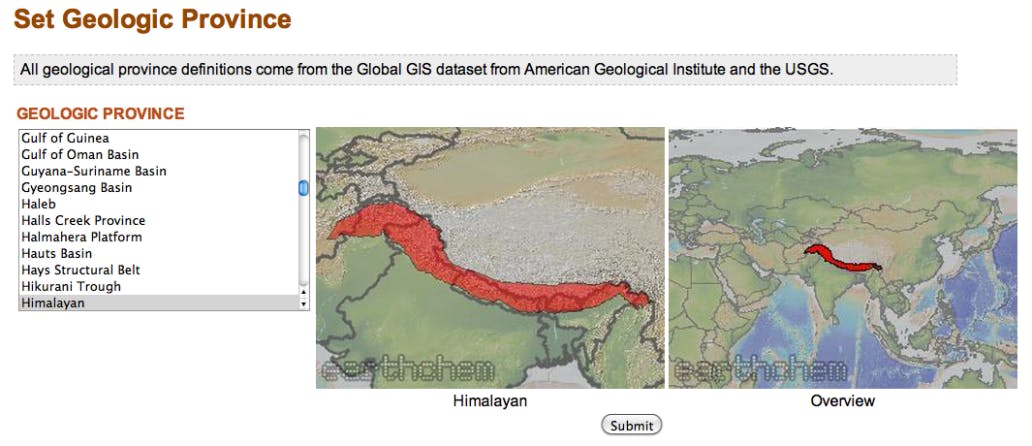
Geologic Province
To select a geologic province, select a province from the list, view the map outline, then click the Submit button to set the constraint. All geologic province definitions come from the Global GIS dataset from American Geological Institute and the USGS.
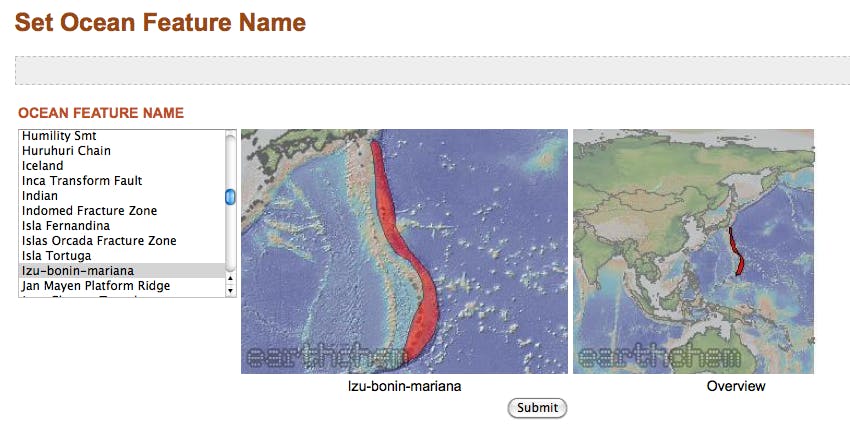
Ocean Feature Name
To select an Ocean Feature, select an ocean feature from the list, view the map outline, then click the Submit button to set the constraint. Ocean feature polygons were defined by EarthChem.
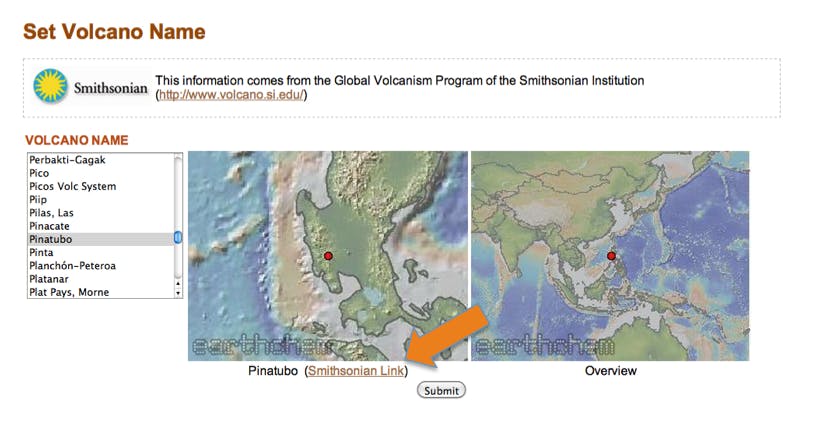
Volcano Name
To select samples from a given volcano, choose from a list of volcano names from the Global Volcanism Program of the Smithsonian Institution. Select a volcano name, view the location in a map, then click the Submit button to set the constraint. You will also be able to follow a link to the Smithsonian volcano page for more information.
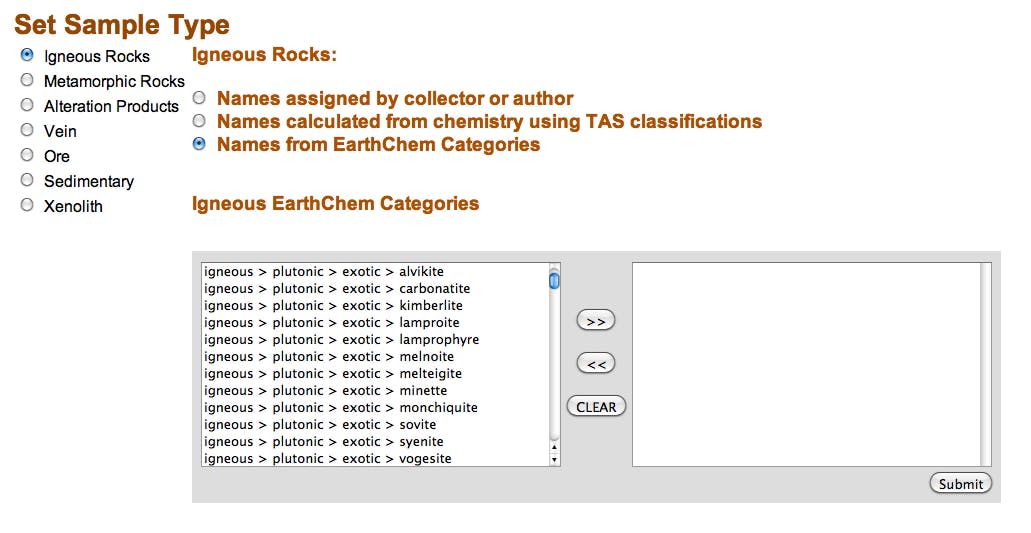
Sample Type
Under sample type, you first choose among a list of general rock types. Next, you will have the option of choosing a more detailed rock type (e.g. gabbro, amphibolite).
For Igneous and Sedimentary categories, there are more customized choices.
- Names assigned by collector or author: These names are the collector-assigned name in the publication, regardless of the chemical composition.
- Names calculated from chemistry using TAS classifications (for igneous rocks): TAS stands for Total Alkali Silica, the classification system assigns names to volcanic rocks based on the relationship between the combined alkali content and the silica content. This classification is determined by the chemical composition of the sample and disregards the author-given classification.
- Names from EarthChem Categories: EarthChem categories are a standardized naming convention that maps author-given names like “granite” to a standardized, hierarchical vocabulary e.g. “igneous>plutonic>felsic>granite”.
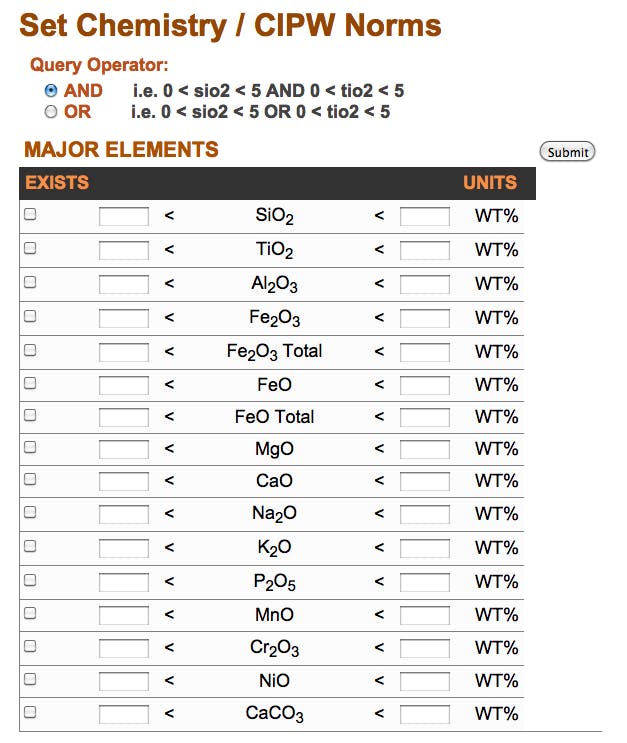
Chemistry
To constrain samples by chemistry or CIPW norms (a calculation based on the typical minerals that may be precipitated from an anhydrous melt at low pressure), first locate the parameter of interest, then click on the box for “exists”. This will automatically fill in the range 0 to 100% in the boxes and will return samples with any value measured for that parameter. If you want a narrower range, enter the lower and upper bounds of the WT% that you are interested in (e.g. 0 to 30%). This sets the constraint to return samples that have a measured value between the minimum and maximum of the parameter.
If you want to set constraints on more than one parameter, click AND or OR to combine the constraints.
Choose the Data Display and Geochemical Parameters
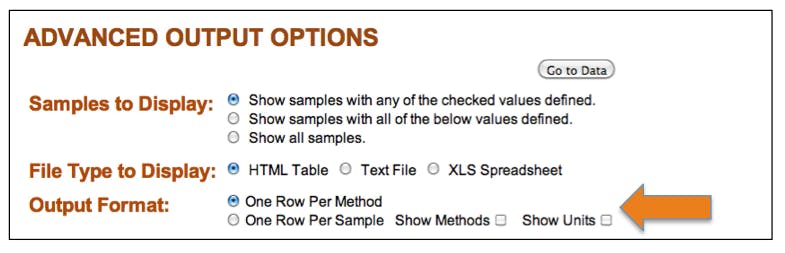
After setting the query constraints and clicking Get Chemical Data, you are presented with a number of display options for the final data table (see image to the right, click to enlarge). Below are examples for some of the different display options, using the initial data query for Ocean Feature = Gakkel Ridge.
Default Display
Under the Samples to Display section, the default display is “Show samples with any of the checked values defined“. This option will display samples with a measured value for any one of the checked parameters. The parameters are pre-checked with the “standard output” items. You can toggle this with the parameters actually represented in the query by clicking the button “Show Items that Exist in Current Query.” Even if a sample only has one parameter in the checked list defined, it will show in your final data table.
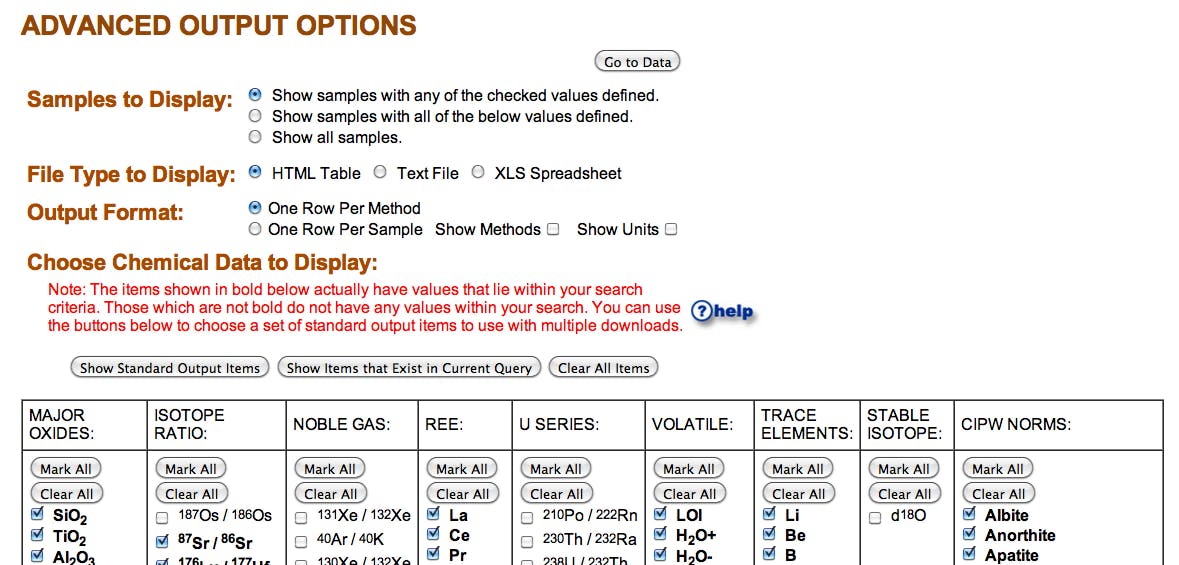
Show Samples with all of the Below Values Defined
Under the Samples to Display section, the second option is “Show samples with all of the below values defined.” If checked, this option will tend to decrease the number of samples displayed. You can clear all of the checked boxes by clicking the “Clear All Items” button directly above the parameter table.
One Row per Sample with Methods and Units
Under the Output Format section, the default option is One Row Per Method. However, you can check the option One Row Per Sample to make the table more compact. In the example to the left, the additional options for Show Methods and Show Units have been checked off. These options create additional columns to the right of each parameter column, detailing the method and unit of the measurement.
Data Output
You can view data several ways. To change output option hit the ‘back’ button on your browser and select another output.
- Data Access – Download data in and HTML table, Text file, or XLS Spreadsheet. Options allow you to choose which chemical items you want displayed.
- Metadata – Choose to view a reference list or a quickly rendered HTML table of samples. Output columns are pre-determined to commonly displayed output.
- Visualization Tools Choose to explore data in various formats. including TAS Diagrams, animation (for samples with age data), Harker diagrams, XYZ plots, dynamic and static maps, or Google Earth kml output. For all options except the the static map and Google earth output, you can activate data points by scrolling down and clicking “Datapoints link to individual sample data?” followed by clicking the “Plot” button. This allows you to view the samples metadata as it appears in its native database”. See below for more details on visualization tools.
- TAS and Harker Diagram Buttons: Click on these buttons to view sample data plotted on a Total Alkali vs. Silica (TAS) diagram subdivided with the classification of Streckeisen et al. (Le Maitre, ed., 2002) or to view (Harker) plots of the compositional variation of Major Oxides vs. Silica. You may modify the size, number of plots, and symbols displayed by using tools at the bottom of the Harker diagram page.
- Static and Dynamic Maps – To view samples on a map click on Static Map. Use the Dynamic map if you would like to click on a location and to view a sample information page. However, the dynamic map works best with queries of than 100 samples.
- Plotting Tools – Create X-Y-Z plots of elements or ratios from your queried data. Explore multiple design options!
- Google Earth – Outputs a kml file viewable in Google Earth. Sample locations link to the native databases and are color-coded by database of origin.
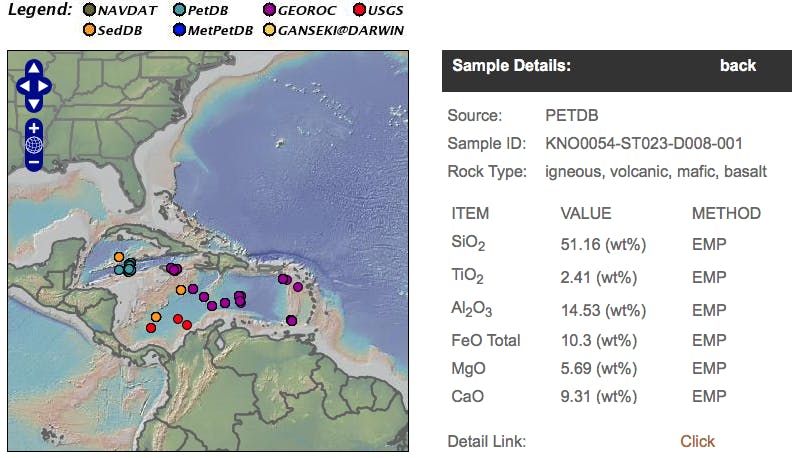
Visualize Sample Locations on Maps
The location of EarthChem samples can be visualized on a number of different maps, including static maps, dynamic maps, and Google Earth.
EarthChem’s static maps are useful for inserting in reports or other visual projects. The files are .jpeg and can be saved to your computer.
EarthChem’s dynamic map option allows you to view your query samples on a topographic map. The map can be zoomed in for closer views. Clicking on the colored dots – the sample locations – will link you to more detailed information for individual samples.
EarthChem sample location and information can be viewed in Google Earth in two ways. Once you get to your sample selection, you can download the results of your query in a KML file, then view it in Google Earth. Clicking on the sample icon brings up a window with more information about the sample.
(Note that the location precision for samples is different for different databases. Some samples may only be reported to one or two decimal places, but some may have up to six decimal places. Please be aware of this as you zoom in on samples.)
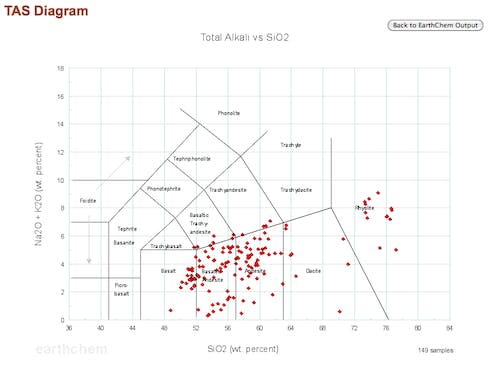
Visualize Geochemical Data on TAS and Harker Diagrams
Once you have obtained your sample selection, you can view a TAS (Total Alkali vs SiO2) or Harker (oxides of elements against SiO2) Diagrams. Simply click on the buttons under “Visualization Tools” after completing your query.
A Total Alkali Silica (TAS) Diagram might be useful to view your sample data if you are concerned with volcanic rocks. These diagrams plot the bulk total alkalis (sodium & potassium) versus the silica content of the rocks from your samples.
Harker diagrams, or variation diagrams, are useful for detecting geochemical and genetic trends in the petrology of your samples. After clicking on the “Plot Harker Diagrams” button you will be brought to a page with a number of Harker diagrams displaying your sample data. At the bottom of the page are various options for modifying the appearance of the diagrams. You can also select an option that allows you to link directly to each data sample point’s information from the graphs.
Advanced Data Display Options – Showing Units and Methods
EarthChem Portal has several options for displaying geochemical output. Did you know that you have different options for displaying measurement units and analytical methods?
For example, because the data is compiled from different databases, you may want to see what Unit of measurement is being reported. You can achieve this by clicking on the “Show Units” option in the “Advanced Output Options” screen. Another column will be added to the output table that lists the unit. The same can be done for Method. The default is that the output table displays one row per method, which consolidates rows but does not allow for the unit or method display options.